The Community Dashboard provides your community with access to detailed crime statistics. Using the Community Dashboard module, agencies can share detailed crime statistics with the public. The dashboard allows the public to view the rate of incidents and offenses as well as examine crime rates within their community. It can identify crime hotspots by viewing incidents on Google Maps™. The dashboard offers complete customization on how and when to display crimes, locations, and date ranges.

Community Dashboard is customizable to any agency's needs
Community Dashboard Key Features
Community Access to Information
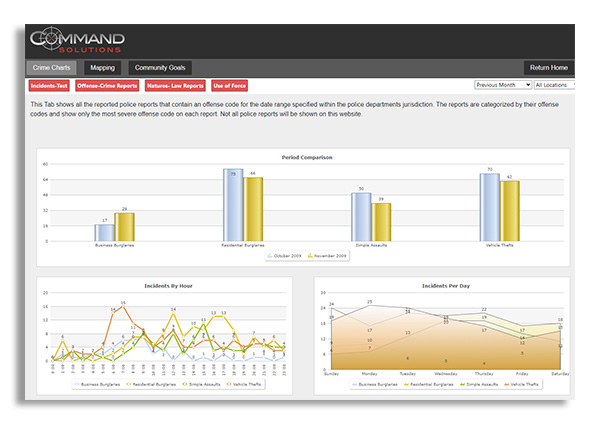
This dashboard provides your community with crime rates and statistics based on more than 250 Motorola reports. The public can view incidents and offenses, examine specific types of incidents, and see how crime has increased or decreased over agency-determined periods of time.
They can also see how frequently crime occurs within zones like schools, neighborhoods, business districts, or other locations defined by your agency. A customizable period comparison chart provides users with a visual representation of crime for the days and location selected, while a pie chart allows your community to see a breakout of each crime category.
The public can also view the number of incidents by day or hour on a line graph.
Incident Mapping
The Community Dashboard module enables viewers to see incidents or offenses on Google Maps, allowing them to see crime hotspots and determine their proximity to events.
You can choose to show partial map addresses or no addresses to protect the privacy of residents where the incidents occurred.
Customizable Dashboard Features
Customize the Community Dashboard module to meet your agency’s specific needs. The dashboard gives your agency complete control in determining what information is displayed for public viewing.
You can choose which incident categories are shown, decide whether to display incidents or offenses, define comparison dates and locations, and add your agency’s name and badge to the dashboard header.
Community Dashboard Advantages
- Provides the public with access to incident information.
- Enables public to compare crime statistics over certain periods, day-by-day, hour-by-hour, etc.
- Allows your community to see crime hotspots by viewing incidents and offenses on Google Maps.
- Customizes the dashboard with specific crime categories and your agency’s information.